ABOUT DIMIC2059
BREAKING THE INTRA-DAY CODE OF THE E-MINI FINANCIAL FUTURES INDEX –
MULTI-YEAR REAL-TIME STUDY OF THE S&P500, DJ & NASDAQ FUTURES
If about 65% of trading is by high-level corporate computers, how can an intra-day trader find more level trading ground, excuse the rhetorical question, the answer is an engulfing formula developed after many years of real-time study of the S&P500, DJ and Nasdaq Futures? The objective was to provide a real-time daily window on the market, custom fit to each new intra-day market.
In developing the new proprietary software, old measures or repackaging of old or usual measures were set aside. In addition to analyzing each individual E-Mini financial commodity chart, a new cross-reference indicator developed. The DMIC individual time and price indicators of the S&P500, NASDAQ, DJ and the Russell 2000 can coalesce to provide a significant indicator.
%
65% of trading is by high level corporate computers
The research produced the ‘Daily Matrix Island Combination’ software which gives identities to the various iterations the market may take on any day. And gives instant feedback in real time.
The software projects a detailed critical path of intra-day market movement, including each day’s critical ‘Time Waves’ and ‘Price Waves’ using a number of ‘Time Teams’ that create the ‘Daily Market Time & Price Meter’ ™ among a set of new indicators. These ‘Time Teams’ check on the markets intra-day ‘Critical Path’
The DMIC2059™ Software looks at each day as a separate entity. Its’ ability to project a trend day, a ‘buy day’ or ‘sell day’ – meant non-trend days had to be recognize. And non-trend and ‘Doji’ days are recognized.
The software is a one-stop analysis of each intra-day market. It stands alone. The architecture of the software was built to roll-over with the market over time, organically updating itself each day.
The market is a multi-dimensional mix of elements that need unification in an understandable format which sharply focusses on the ropes and pulleys that move each separate intra-day market.
Market character changes almost daily. Rarely is the same iteration repeated the next day. Each day, new support and resistance are set, new break-out and reversal prices form, time and price relationships change. This change information is both varied and numerous, as many as twenty to fifty price and time calculations need to be organized in meaningful dimensions. In a meaningful context.
Each new day is a custom fit. Instant analytic intelligence feedback allows the trader to concentrate on executing trades, releasing the trader from too many demands of instant analysis. The software is an interactive trading partner.
In detail the DMIC2059 software projects the type of day to expect, volatile or not. Relates that volatility to the number of waves to expect and projects which wave is the key trend wave and which wave to reject as a trend wave. It pinpoints the prices where the market is expected to break-out or reverse. Included are details of preferred conditions that match certain days. These price points are up to the minute and available after the market has opened and once the DMIC software is set for the day.
%
More one-dimensional tools may be the reason it is claimed about 93% of traders lose.
More one-dimensional tools may be the reason it is claimed about 93% of traders lose. The conventional approach tends to lack context, often taking a train without knowing where the objective is. Immediate market context is a key.
Numerous theories such as Taylor’s ‘Three Day Book Theory’ – Elliot Wave – ‘Value Areas’ – Moving Averages & other algorithms play a part in trading, but the DMIC2059 software’s focus is solely on each individual intra-day market. It’s not irrelevant that ‘time’ is largely absent from most other theories, time is critical to any intra-day analysis.
The on-going intra-day DMIC’s bear a strong relationship to each other. Providing strong indicators as the markets over-lap between Daily Matrix Island Combinations and DMICs called out as ‘key’ during the week.
The on-going DMICs can also signal a key reversal in the longer term market. For example in the declining market of 2009, after a decline of about 120 S&P points(1200 Dow points), the DMIC produced an unexpected strong Buy DMIC indicator. Not only did the market decline stop that day, but it set a market low for the next three weeks or so.
Similarly within the framework of Taylor, as the three-day rotation takes shape, the expected daily rotation is checked by DMIC and an early am fit can be projected.
The Daily Matrix Island Combination often recognizes a ‘value area’ on the day they form, as opposed to being called out after the market day has closed for the next day’s trading watch.
Focused from about thirty days prior, layering forward, market history is carried forward. DMIC sieves trading history into the current day, creating a current window for the new intra-day market.
The multi-dimensional aspect of time and price has not been fully appreciated. Real-time needs to be converted to trading time. Trading times can vary according to the current intra-day iteration. Awareness of time and price and trading time and price are relevant.
17,152 different combinations
During the many years of real-time research, there were times when doubts arose, when thoughts & processes needed re-examination, doubling back, more evidence. A few particular articles and books helped. One day I read an article in the Sunday papers that helped keep me going. I had been working on many combinations of price and time, but had not cracked the code to my full satisfaction. That Sunday I read about the theory of Combinatorics for the first time. It began with Archimedes puzzle. It was thought Archimedes puzzle pieces were a game to make figures with, such as an elephant. In fact, the article reported, the objective of the 14 irregular shaped pieces is to use only eleven pieces to make a square and to determine how many different combinations of pieces can be used to make a square. The answer was 17,152 different combinations. The key to the puzzle is the thing that caught my interest. Three different pairs are always needed to form a square. A constant pre-coded combination was needed to unlock the puzzle, constant elements were the foundation of the final build. But finding 17,152 combinations were hidden in 14 pieces, it became clear the Daily Matrix Island Combination had a much larger number of inter-relationships that needed unlocking than I had thought. The scope of the DMIC would have to expand.
Later I was very happy to read Benoit Mandelbrot & Richard Hudson’s book ‘The (mis)Behavior of Markets.’ Mandelbrot was the inventor of fractal geometry, recognizing the reproduction intricacies of patterns over varying scales of time and space. They pointed out a number of things that fit with my research work. And noted the strongest market ‘finger print’ correlations were those with the shortest windows. This fit with the DMIC theory of ‘time teams.’ Their work supported the ‘trade time’ theory and they noted that large market declines can take place in a very limited number of days, as can large gains. This points to the urgency of understanding each trading day and the ‘finger print’ efficacies of each new intra-day market.
A simple metaphor in summary. The market is an island in an ocean of tidal ebb and flow action. Various volcanoes on the sea floor erupt regularly, mainly within measured parameters, but constantly shifting the ebb and flow within the parameters. At times the parameters are broken. Daily monitoring indicates the formation of new barriers and the strength of the ebb and flow waves.
CHART EXAMPLES
For proprietary reasons the total codes are not shown –some indicators are shown.The Express Indicator Manual codes are always available for client’s easy reference, while needed.
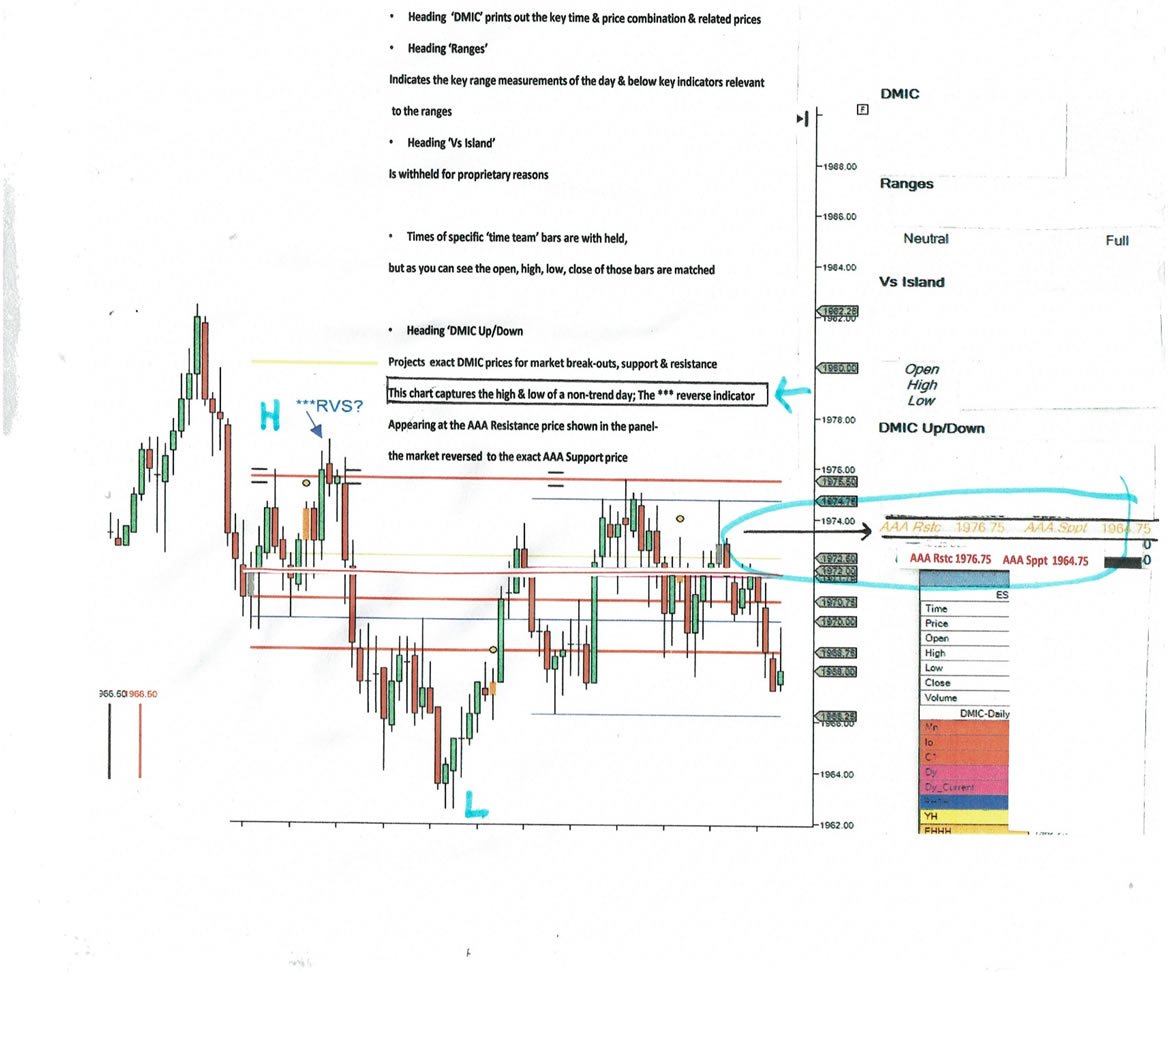
First chart indicator is a ’NON-TREND’ E-Mini S&P Futures day, as projected by DMIC software;
- The non-trend reversal prices show in the software panel
- By ‘AAA Rstc’ ….price 1976.75 & ‘AAA Sppt’ ….price 1964.75
- ‘AAA’ price first tested (1976.75) reverses to opposite ‘AAA’ price (1964.75)
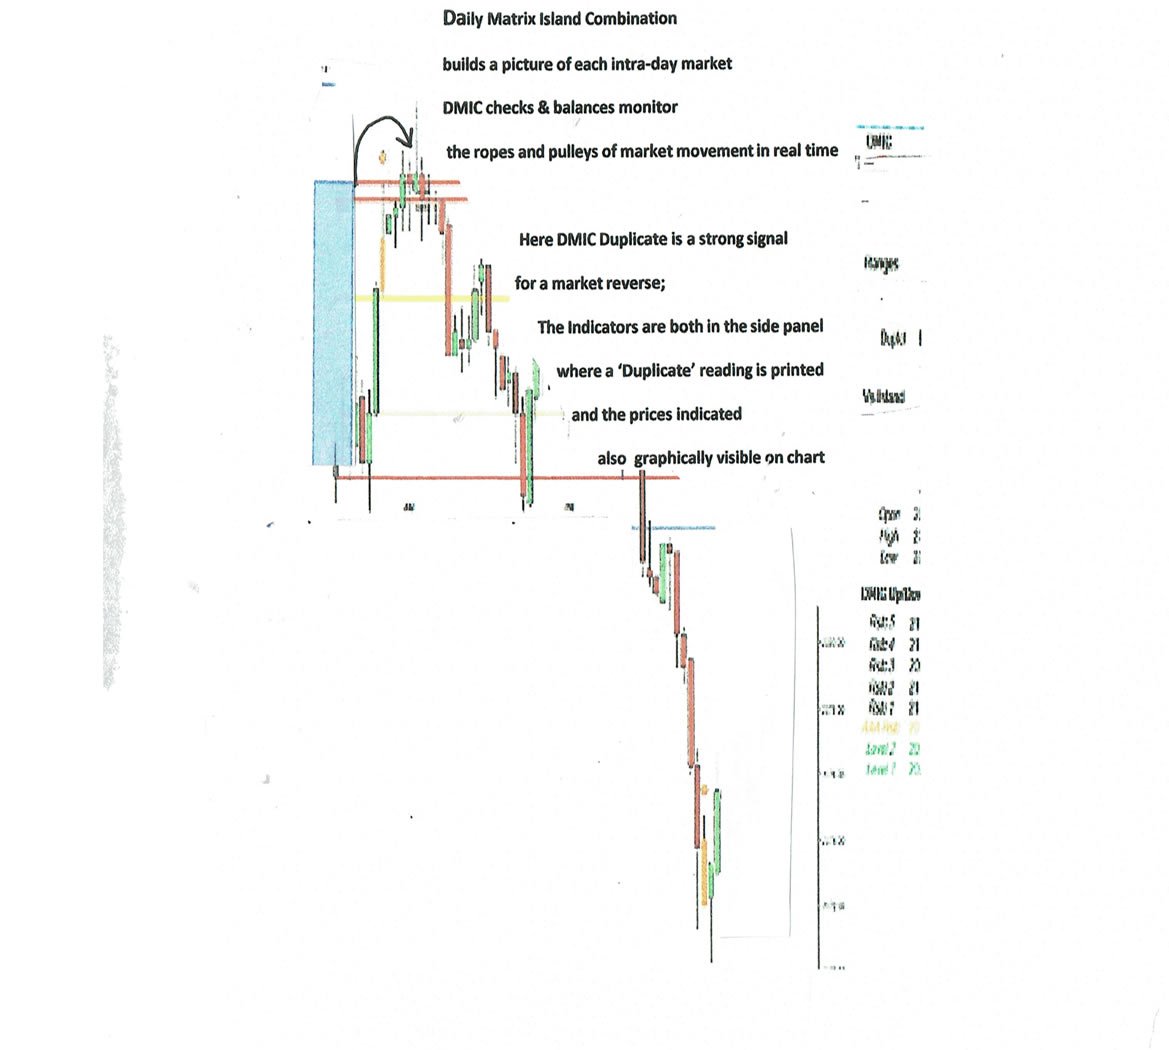
Second Chart Indicator is a ‘SELL’ signal at key DMIC Duplicate prices projected by the software panel;
- The DMIC Duplicate is also seen on the chart as two DMIC lines close together at the high of the DMIC rectangle
- The last high of the day was projected by DMIC software
- Confirmation of reversal at a high of day is confirmed by a market price reversal inside DMIC
Third Chart highlights a strong DMIC RALLY projection;
- In the side panel, the Combination indicates a strong preference for a rally day
- Under range is a signal to prefer a PM trend wave
- *** first wave signal caution reverse signal – to re-test near the top of DMI rectangle
- The last low of the day was the high of DMI rectangle at 2655.50 – high of the day was 2690.25
- Chart 1/30/2019 was an unusual day – Fed. Day Announcement- used as an illustration only


Fourth chart indicator is a strong ‘SELL’ preference at 2606.00;
- DMIC rectangle indicates the last high of the day on the panel at 2606.00
- DMIC software projected an early reversal; ‘BREMR’ fast rally signal met its’ objective at 2606
- the break-down price below the DMI is in the panel at Level 1 -2586.25 & again at L2- 2569.25
- the PM rectangle indicator is another key measure –
- a close above or below indicating preferred PM continuation or reversal
- the market closed below & continued sliding
- the ‘tighten stops’ indicator was three bars from the low of the day at 2535
- the chart shows uncommon ‘Golden Rectangle’ on the left of the chart – Indicator of a one-sided break-out confirming the high reversal at 2606.00
Futures, foreign currency and options trading contains substantial risk and is not for every investor. An investor could potentially lose all or more than the initial investment. Risk capital is money that can be lost without jeopardizing ones financial security or lifestyle. Only risk capital should be used for trading and only those with sufficient risk capital should consider trading. The information on this dmic2059 website is solely for informational purposes. Nothing on this website is a solicitation to buy or sell futures or options. No representation is made that any account will achieve profits or losses similar to those discussed on this website. Persons acting on this information are responsible for their own actions and choices. Past performance of any trading system or methodology is not necessarily indicative of future results. CFTC Rules 4.41 - Hypothetical or Simulated performance results have certain limitations, unlike an actual performance record, simulated results do not represent actual trading. Also, since the trades have not been executed, the results may have under-or-over compensated for the impact, if any, of certain market factors, such as lack of liquidity. Simulated trading programs in general are also subject to the fact that they are designed with the benefit of hindsight.